Code
library(dplyr)
library(tidyr)
library(ggplot2)
library(scales)
library(knitr)
library(sf)
library(leaflet)
library(leafpop)This report was generated using AI under general human direction. At the time of generation, the contents have not been comprehensively reviewed by a human analyst.
library(dplyr)
library(tidyr)
library(ggplot2)
library(scales)
library(knitr)
library(sf)
library(leaflet)
library(leafpop)# Pre-computed data from the ice-detention pipeline.
# Run copy-data.sh to refresh from the pipeline project.
ice_fy25 <- readRDS("data/ice_fy25.rds")
ddp_fy25 <- readRDS("data/ddp_fy25.rds")
ddp_fy25_keyed <- readRDS("data/ddp_fy25_keyed.rds")
daily_totals <- readRDS("data/daily_totals.rds")
unmatched <- readRDS("data/unmatched.rds")
daily_unmatched <- readRDS("data/daily_unmatched.rds")
monthly_unmatched <- readRDS("data/monthly_unmatched.rds")
peak_fy25 <- readRDS("data/peak_fy25.rds")
biden_unmatched <- readRDS("data/biden_unmatched.rds")
trump_unmatched <- readRDS("data/trump_unmatched.rds")
daily_unreported <- readRDS("data/daily_unreported.rds")Throughout this report, facility-level summaries distinguish between facilities with ADP ≥ 2 and those with ADP < 2. Facilities averaging fewer than two detainees per day—typically hospitals, occasional-use hold rooms, and other transient placements—account for many DDP facility codes but negligible population. Separating them keeps attention on facilities with substantive detention activity.
The DDP (Deportation Data Project) provides daily facility-level detention counts. To compare with the ICE FY25 annual statistics, we average DDP daily counts from October 1, 2024 through September 24, 2025—the date stamp on the FY25 spreadsheet.
tibble(
  Source      = c("ICE FY25 annual stats", "DDP daily average"),
  Facilities  = c(nrow(ice_fy25), nrow(ddp_fy25)),
  `Total ADP` = c(round(sum(ice_fy25$ice_adp, na.rm = TRUE)),
                   round(sum(ddp_fy25$ddp_adp)))
) |>
kable()| Source | Facilities | Total ADP |
|---|---|---|
| ICE FY25 annual stats | 189 | 47549 |
| DDP daily average | 853 | 50130 |
The DDP covers 853 facility codes while the ICE spreadsheet lists 189 facilities. The DDP’s higher total reflects the many smaller facilities (hold rooms, federal prisons, medical facilities) not included in the ICE annual statistics.
fy_breaks <- as.Date(c("2023-10-01", "2024-10-01", "2025-10-01"))
fy_labels <- data.frame(
  x = as.Date(c("2024-04-01", "2025-04-01", "2025-10-08")),
  label = c("FY24", "FY25", "FY26")
)

ggplot(daily_totals, aes(x = date, y = total_pop)) +
  geom_line(linewidth = 0.3) +
  geom_vline(xintercept = fy_breaks, linetype = "dashed", alpha = 0.4) +
  geom_text(data = fy_labels, aes(x = x, y = max(daily_totals$total_pop) * 1.04,
                                   label = label), inherit.aes = FALSE, size = 3) +
  scale_y_continuous(labels = comma) +
  labs(x = NULL, y = "Total detained population")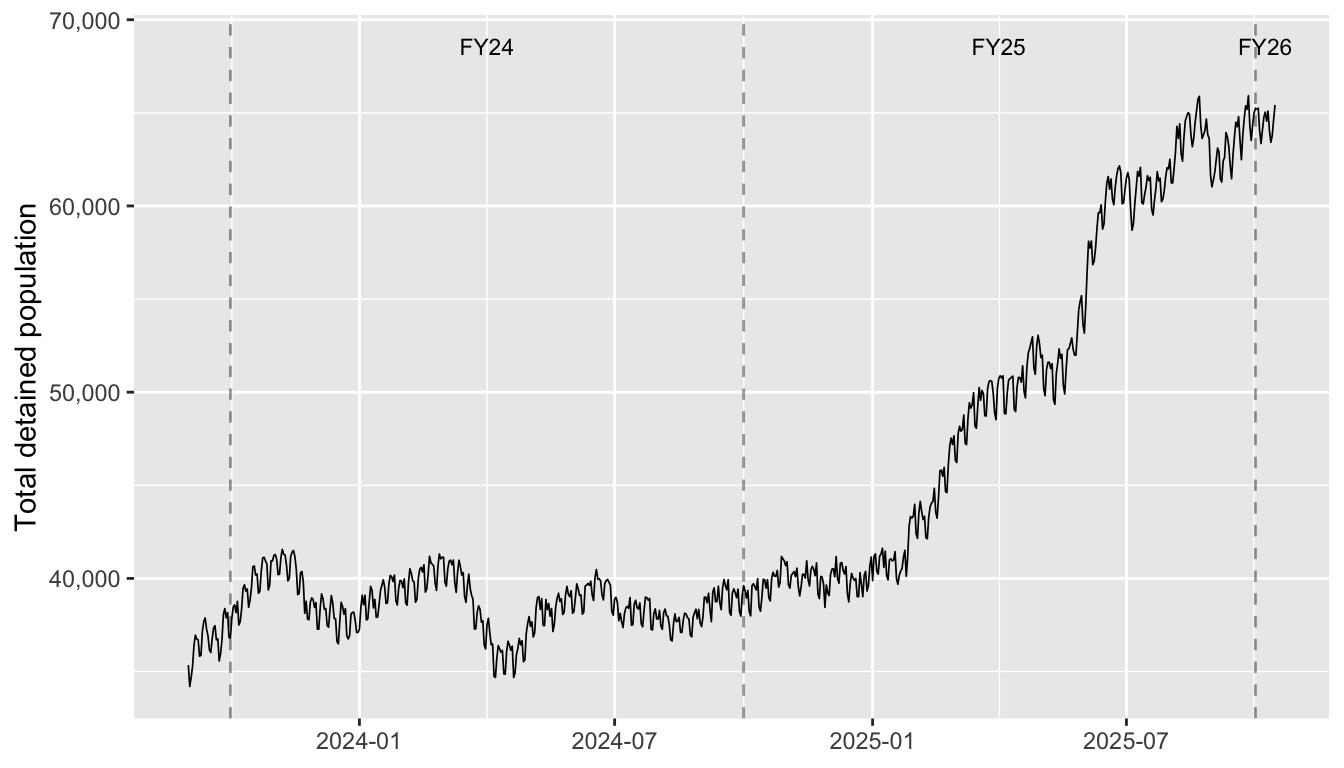
We join the two datasets through canonical facility IDs. Each DDP facility code is mapped to a canonical ID via detloc_lookup_full, which preserves all DETLOC variants from every source (DMCP, DDP, hold/ERO, Vera). Some canonical facilities have multiple codes—for example, Central Arizona Florence Correctional Complex uses CCADCAZ (DMCP) and CCAFLAZ (DDP), and Delaney Hall uses ESSEXNJ (DMCP) and DHDFNJ (DDP). Using the full lookup ensures all codes contribute ADP to the correct facility.
# Aggregate DDP by canonical_id for matched facilities.
ddp_by_canonical <- ddp_fy25_keyed |>
  filter(in_ice_fy25) |>
  group_by(canonical_id) |>
  summarise(ddp_adp = sum(ddp_adp), .groups = "drop")

comparison <- ice_fy25 |>
  group_by(canonical_id) |>
  summarise(
    canonical_name = first(canonical_name),
    ice_adp = sum(ice_adp, na.rm = TRUE),
    .groups = "drop"
  ) |>
  full_join(ddp_by_canonical, by = "canonical_id") |>
  mutate(
    in_ice = !is.na(ice_adp),
    in_ddp = !is.na(ddp_adp),
    diff   = ddp_adp - ice_adp,
    pct_diff = diff / ice_adp * 100
  )

matched <- comparison |> filter(in_ice & in_ddp)

tibble(
  Category = c("In both sources", "ICE only (no DDP match)",
               "Matched: ICE total ADP", "Matched: DDP total ADP",
               "Matched: aggregate difference"),
  Value = c(
    sum(comparison$in_ice & comparison$in_ddp),
    sum(comparison$in_ice & !comparison$in_ddp),
    round(sum(matched$ice_adp, na.rm = TRUE)),
    round(sum(matched$ddp_adp, na.rm = TRUE)),
    paste0(round(sum(matched$ddp_adp, na.rm = TRUE) -
                   sum(matched$ice_adp, na.rm = TRUE)),
           " (", round((sum(matched$ddp_adp, na.rm = TRUE) /
                           sum(matched$ice_adp, na.rm = TRUE) - 1) * 100, 2), "%)")
  )
) |>
kable()| Category | Value |
|---|---|
| In both sources | 188 |
| ICE only (no DDP match) | 0 |
| Matched: ICE total ADP | 47549 |
| Matched: DDP total ADP | 48587 |
| Matched: aggregate difference | 1038 (2.18%) |
both_nonzero <- matched |> filter(ice_adp > 0, ddp_adp > 0)

ggplot(both_nonzero, aes(x = ice_adp, y = ddp_adp)) +
  geom_abline(slope = 1, intercept = 0, linetype = "dashed", alpha = 0.5) +
  geom_point(alpha = 0.6) +
  scale_x_log10(labels = comma) +
  scale_y_log10(labels = comma) +
  labs(x = "ICE FY25 ADP (annual stats)", y = "DDP mean daily population")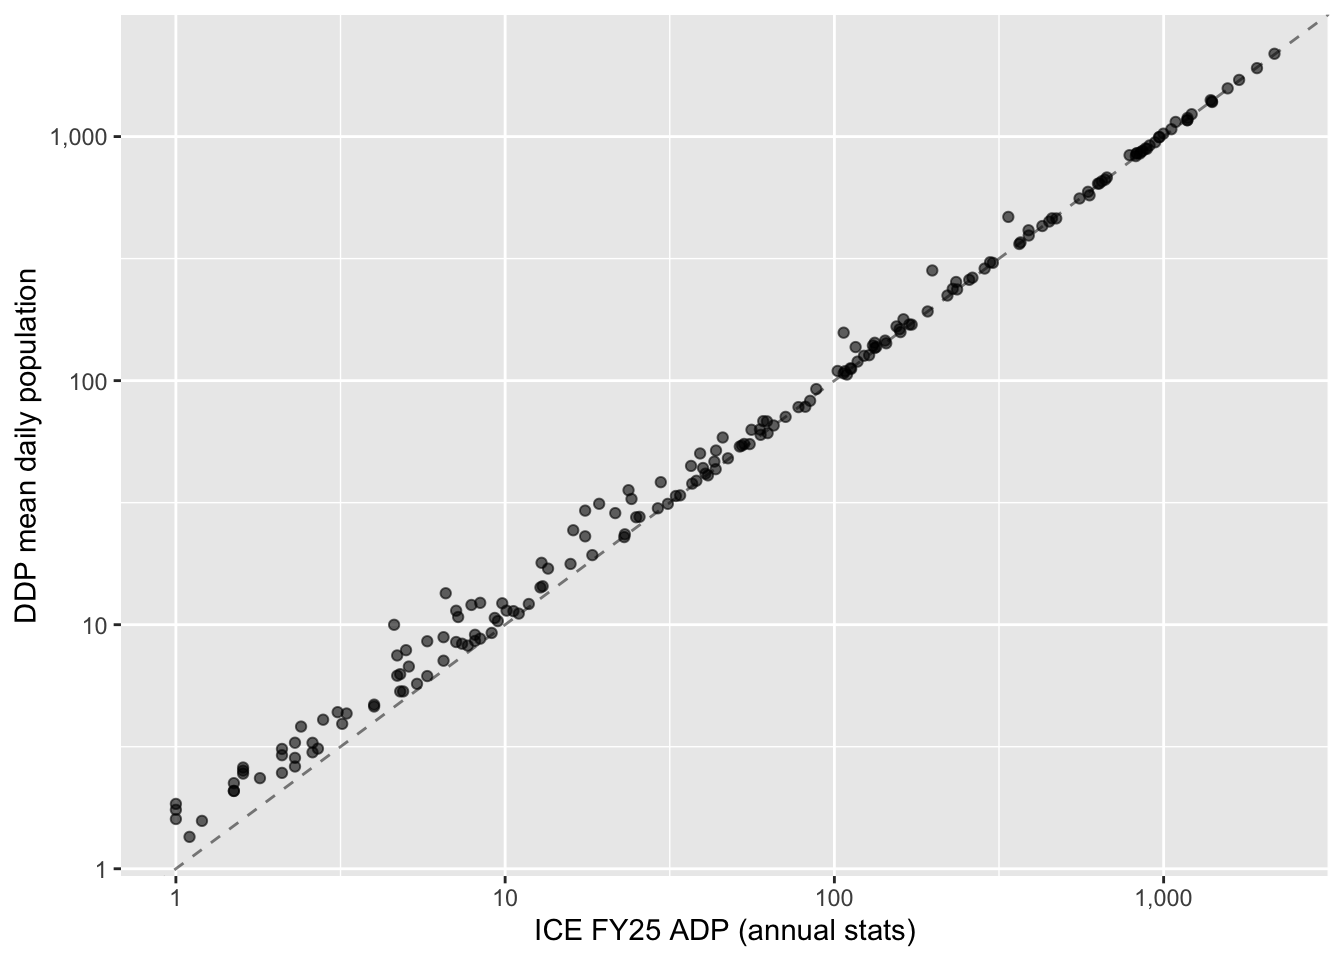
tibble(
  `Agreement band` = c("Within 10%", "Within 25%", "Within 50%", ">50% difference"),
  Facilities = c(
    sum(abs(both_nonzero$pct_diff) <= 10),
    sum(abs(both_nonzero$pct_diff) > 10 & abs(both_nonzero$pct_diff) <= 25),
    sum(abs(both_nonzero$pct_diff) > 25 & abs(both_nonzero$pct_diff) <= 50),
    sum(abs(both_nonzero$pct_diff) > 50)
  )
) |>
kable()| Agreement band | Facilities |
|---|---|
| Within 10% | 115 |
| Within 25% | 26 |
| Within 50% | 30 |
| >50% difference | 17 |
Among the 188 matched facilities with nonzero ADP in both sources, 115 agree within 10%. The log-scale correlation is 0.998.
abs_diff <- abs(both_nonzero$diff)
tibble(
  `Difference band` = c("< 5", "5–25", "25–100", "100–500", "> 500"),
  Facilities = c(
    sum(abs_diff < 5),
    sum(abs_diff >= 5 & abs_diff < 25),
    sum(abs_diff >= 25 & abs_diff < 100),
    sum(abs_diff >= 100 & abs_diff < 500),
    sum(abs_diff >= 500)
  ),
  `Total excess ADP` = c(
    round(sum(both_nonzero$diff[abs_diff < 5])),
    round(sum(both_nonzero$diff[abs_diff >= 5 & abs_diff < 25])),
    round(sum(both_nonzero$diff[abs_diff >= 25 & abs_diff < 100])),
    round(sum(both_nonzero$diff[abs_diff >= 100 & abs_diff < 500])),
    round(sum(both_nonzero$diff[abs_diff >= 500]))
  )
) |>
kable()| Difference band | Facilities | Total excess ADP |
|---|---|---|
| < 5 | 126 | 146 |
| 5–25 | 54 | 432 |
| 25–100 | 7 | 329 |
| 100–500 | 1 | 131 |
| > 500 | 0 | 0 |
The net difference across all 188 matched facilities is 1038 ADP (DDP minus ICE). Positive values indicate DDP counts higher than ICE.
# Log-modulus transform: sign(x) * log10(|x| + 1)
log_mod <- function(x) sign(x) * log10(abs(x) + 1)
log_mod_inv <- function(x) sign(x) * (10^abs(x) - 1)

ggplot(both_nonzero, aes(x = diff)) +
  geom_histogram(bins = 50) +
  scale_x_continuous(
    transform = scales::new_transform("logmod", log_mod, log_mod_inv),
    breaks = c(-1000, -100, -10, 0, 10, 100, 1000),
    labels = comma
  ) +
  labs(x = "ADP difference (DDP \u2212 ICE)", y = "Facilities")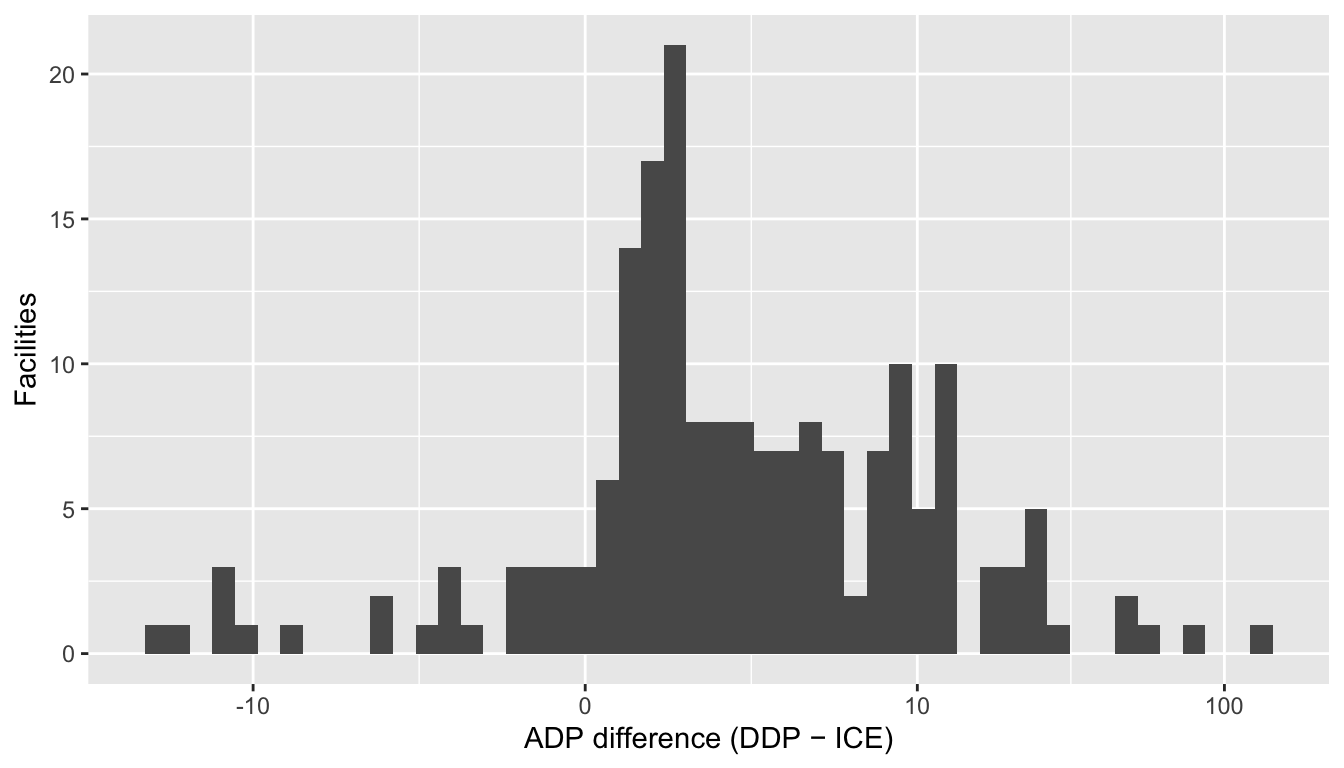
ice_only <- comparison |> filter(in_ice & !in_ddp)
if (nrow(ice_only) > 0) {
  ice_only |>
    select(canonical_id, canonical_name, ice_adp) |>
    mutate(ice_adp = round(ice_adp)) |>
    arrange(desc(ice_adp)) |>
    kable(col.names = c("ID", "Facility", "ICE ADP"))
}
All ICE FY25 facilities have a matching DDP facility code.
663 of 853 DDP facility codes do not appear in the ICE FY25 annual statistics. These are facilities where ICE holds detainees but which are excluded from the published spreadsheet.
Facility types are drawn from the Vera Institute’s classification system. “Dedicated” facilities are purpose-built or contractually dedicated to ICE detention. “Non-Dedicated” are county jails and other facilities that also hold ICE detainees. “Hold/Staging” are short-term ERO processing rooms. “Federal” includes BOP prisons and USMS facilities.
unmatched |>
  group_by(type_grouped, adp_class) |>
  summarise(
    Facilities = n(),
    `FY25 ADP` = round(sum(ddp_adp)),
    .groups = "drop"
  ) |>
  arrange(desc(`FY25 ADP`)) |>
kable(col.names = c("Facility type", "ADP class", "Facilities", "FY25 ADP"))| Facility type | ADP class | Facilities | FY25 ADP |
|---|---|---|---|
| Hold/Staging | ADP ≥ 2 | 77 | 1103 |
| Federal | ADP ≥ 2 | 10 | 206 |
| Dedicated | ADP ≥ 2 | 2 | 186 |
| Hold/Staging | ADP < 2 | 101 | 60 |
| Medical | ADP ≥ 2 | 7 | 37 |
| Medical | ADP < 2 | 221 | 32 |
| Non-Dedicated | ADP < 2 | 147 | 25 |
| Non-Dedicated | ADP ≥ 2 | 6 | 22 |
| Federal | ADP < 2 | 75 | 18 |
| Other/Unknown | ADP ≥ 2 | 1 | 5 |
| Family/Youth | ADP ≥ 2 | 1 | 3 |
| Dedicated | ADP < 2 | 6 | 1 |
| Family/Youth | ADP < 2 | 4 | 0 |
| Other/Unknown | ADP < 2 | 4 | 0 |
| Unclassified | ADP < 2 | 1 | 0 |
The 663 unmatched facilities account for a full-year ADP of roughly 1,699. Of those, 559 facility codes average fewer than 2 detainees per day, contributing 136 ADP in total.
dedicated_unmatched <- unmatched |>
  filter(type_grouped == "Dedicated")

if (nrow(dedicated_unmatched) > 0) {
  dedicated_unmatched |>
    select(detention_facility_code, detention_facility, state, ddp_adp, adp_class) |>
    mutate(ddp_adp = round(ddp_adp)) |>
    arrange(desc(ddp_adp)) |>
    kable(col.names = c("DETLOC", "Facility name", "State", "FY25 ADP", "ADP class"))
}| DETLOC | Facility name | State | FY25 ADP | ADP class |
|---|---|---|---|---|
| FLDSSFS | FLORIDA SOFT-SIDED FACILITY-SOUTH | FL | 170 | ADP ≥ 2 |
| FLBAKCI | BAKER C. I. | FL | 16 | ADP ≥ 2 |
| BERNANM | BERNALILLO COUNTY DET CTR | NM | 0 | ADP < 2 |
| BIINCCO | BI INCORORATED, GEO GROUP COMPANY | CO | 0 | ADP < 2 |
| BPC | BOSTON SPC | MA | 0 | ADP < 2 |
| CVANXCA | CENTRAL VALLEY ANNEX | CA | 0 | ADP < 2 |
| FLDADCI | DADE CORRECTIONAL INST | FL | 0 | ADP < 2 |
| LPAPSAZ | LA PALMA CORR CTR APSO | AZ | 0 | ADP < 2 |
8 Dedicated facilities appear in DDP but not in ICE FY25, contributing 186 ADP.
ggplot(daily_unmatched, aes(x = date, y = total_pop)) +
  geom_line(linewidth = 0.3) +
  scale_y_continuous(labels = comma) +
  scale_x_date(date_labels = "%b %Y", date_breaks = "2 months") +
  labs(x = NULL, y = "Detained population (unmatched facilities)")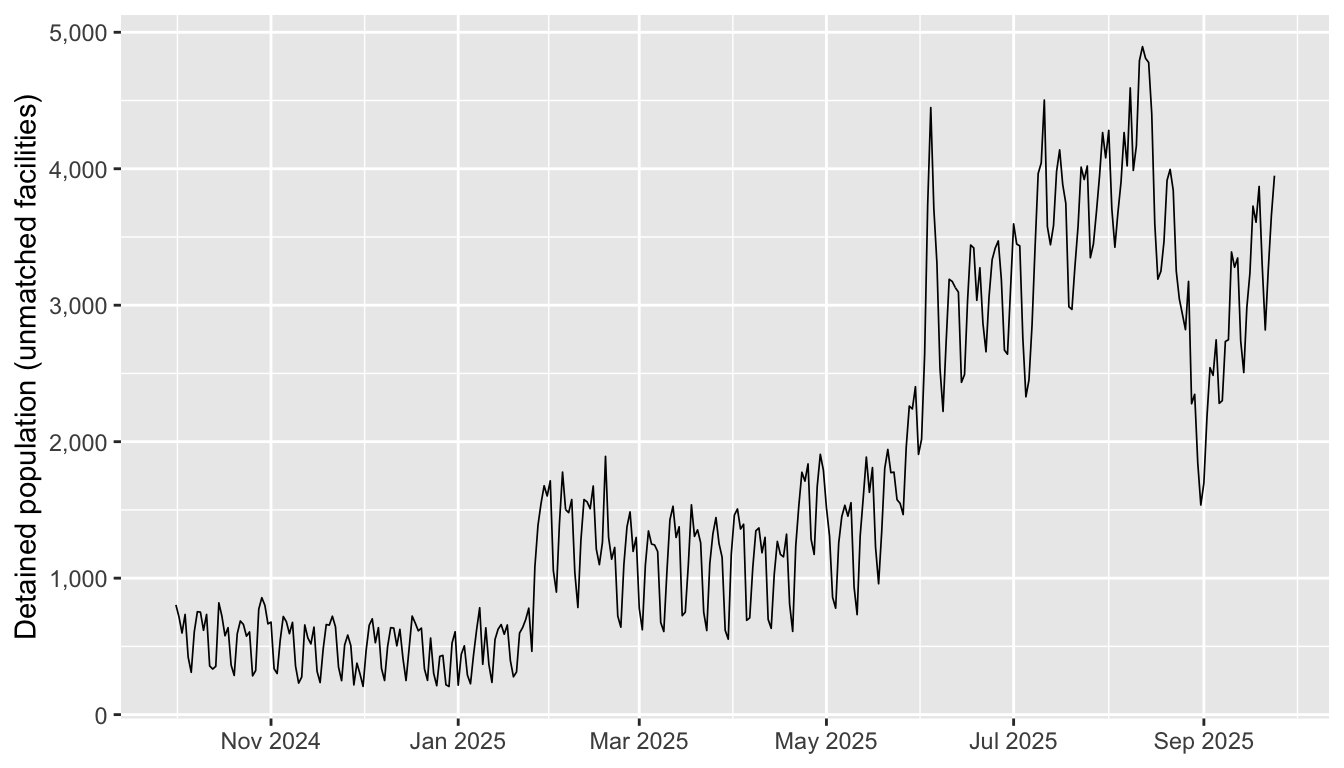
monthly_totals <- monthly_unmatched |>
  group_by(month) |>
  summarise(daily_avg = sum(n_detained) / n_distinct(date), .groups = "drop")

ggplot(monthly_totals, aes(x = month, y = daily_avg)) +
  geom_col() +
  scale_y_continuous(labels = comma) +
  scale_x_date(date_labels = "%b %Y", date_breaks = "2 months") +
  labs(x = NULL, y = "Average daily population")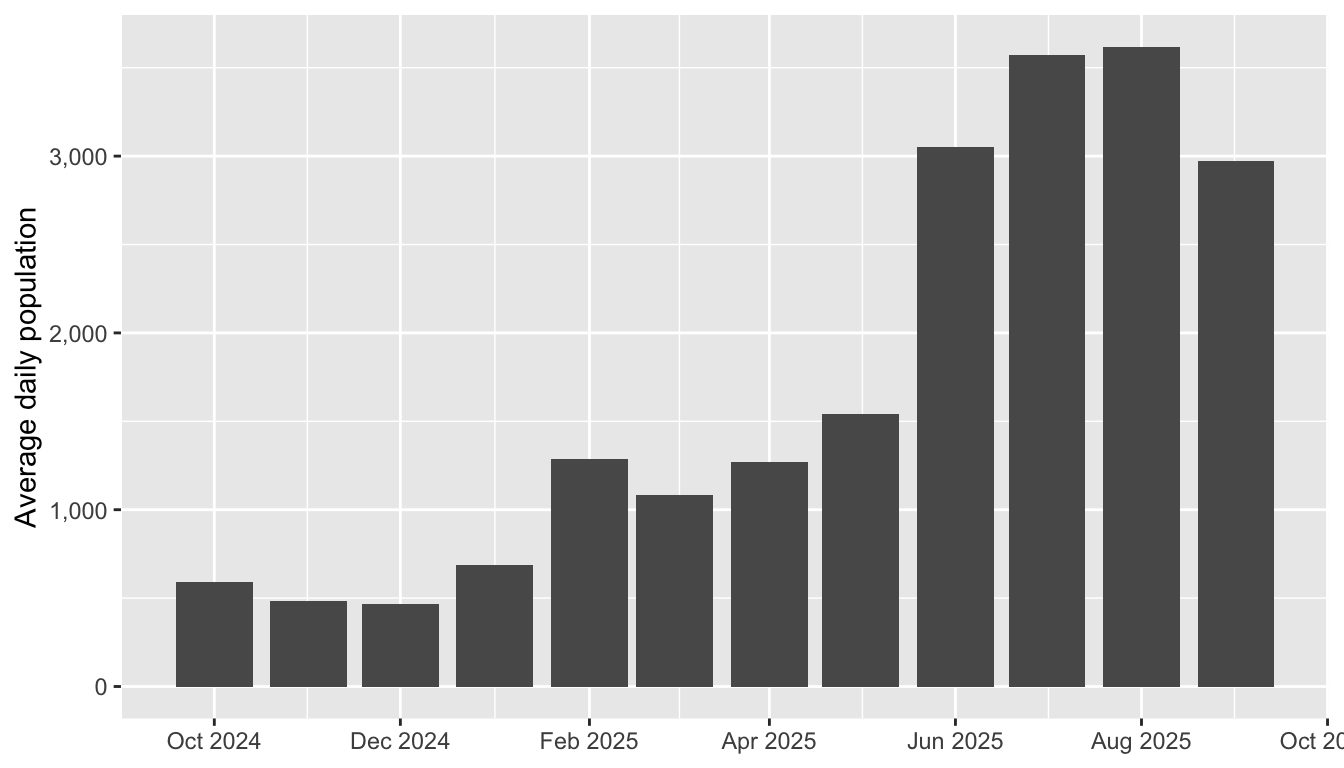
monthly_by_type <- monthly_unmatched |>
  group_by(month, type_grouped) |>
  summarise(daily_avg = sum(n_detained) / n_distinct(date), .groups = "drop")

ggplot(monthly_by_type, aes(x = month, y = daily_avg, fill = type_grouped)) +
  geom_col() +
  scale_y_continuous(labels = comma) +
  scale_x_date(date_labels = "%b %Y", date_breaks = "2 months") +
  labs(x = NULL, y = "Average daily population", fill = "Facility type")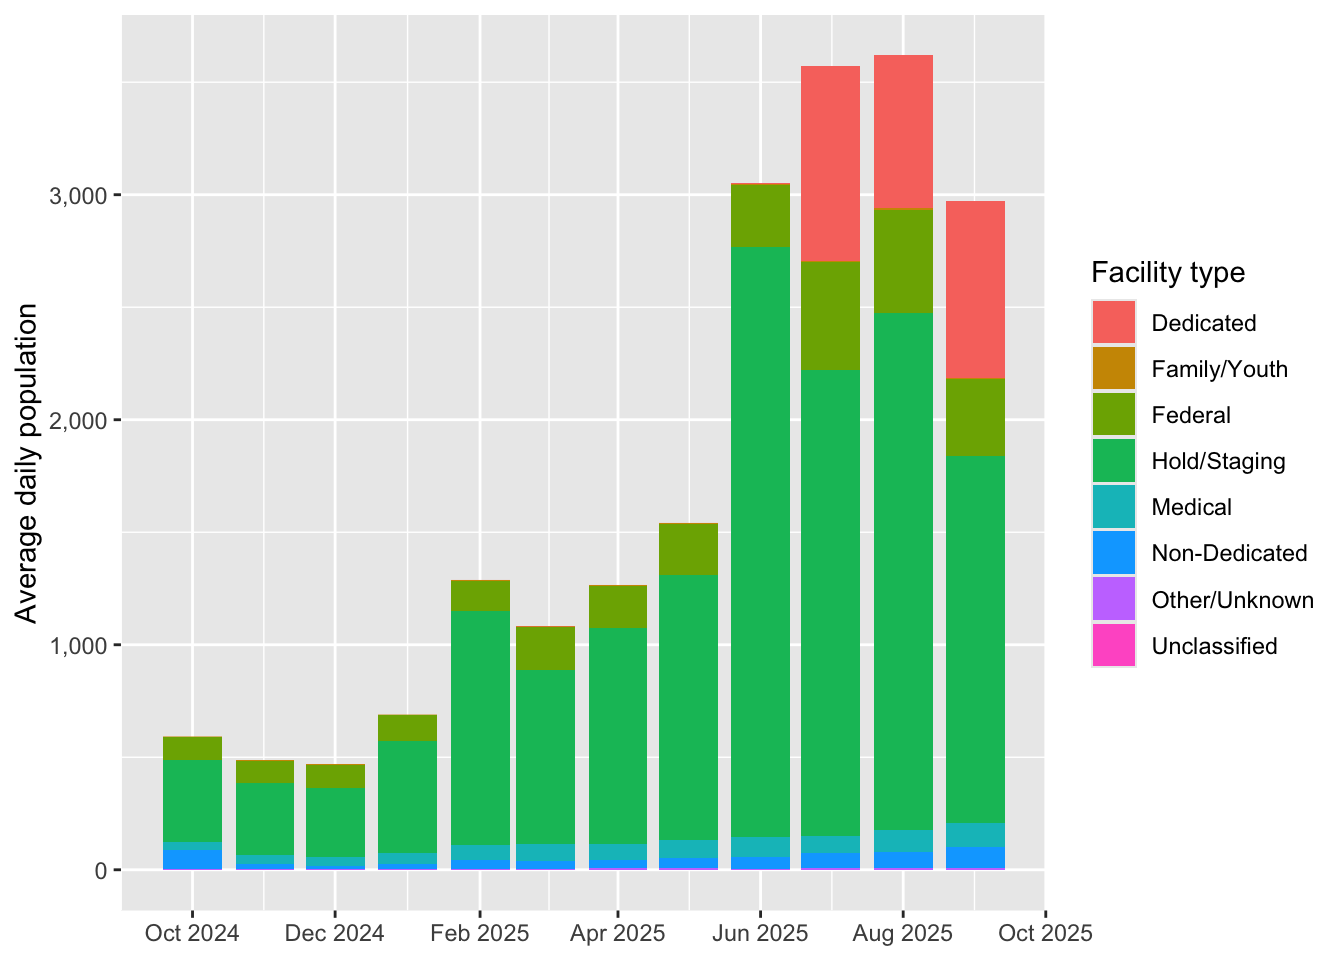
The final 60 days of the FY25 data window (July 27 – September 24, 2025) capture the period of peak detention.
last60_start <- as.Date("2025-07-27")
last60_end   <- as.Date("2025-09-24")

last60 <- monthly_unmatched |>
  filter(date >= last60_start, date <= last60_end)

last60_by_type <- last60 |>
  group_by(type_grouped) |>
  summarise(
    Facilities = n_distinct(detention_facility_code),
    `Daily avg` = round(sum(n_detained) / n_distinct(date)),
    .groups = "drop"
  ) |>
  arrange(desc(`Daily avg`))

last60_total <- sum(last60_by_type$`Daily avg`)

last60_by_type |>
  rename(`Facility type` = type_grouped) |>
kable()| Facility type | Facilities | Daily avg |
|---|---|---|
| Hold/Staging | 178 | 1987 |
| Dedicated | 8 | 787 |
| Federal | 85 | 419 |
| Medical | 228 | 97 |
| Non-Dedicated | 153 | 81 |
| Other/Unknown | 5 | 8 |
| Family/Youth | 5 | 5 |
| Unclassified | 1 | 0 |
In the last 60 days, 3,384 people per day were held in facilities absent from the ICE FY25 annual statistics.
peak_fy25 |>
  arrange(desc(peak_pop)) |>
  head(20) |>
  select(detention_facility, state, type_grouped, peak_pop, peak_date, mean_pop) |>
kable(col.names = c("Facility", "State", "Type", "Peak", "Peak date", "Mean ADP"))| Facility | State | Type | Peak | Peak date | Mean ADP |
|---|---|---|---|---|---|
| EL PASO SOFT SIDED FACILITY | TX | Hold/Staging | 1606 | 2025-08-12 | 243.2 |
| FLORIDA SOFT-SIDED FACILITY-SOUTH | FL | Dedicated | 1482 | 2025-07-30 | 170.3 |
| KROME HOLD ROOM | FL | Hold/Staging | 600 | 2025-02-17 | 36.5 |
| URSULA CENTRALIZED PROCESSING CNTR | TX | Federal | 463 | 2025-07-11 | 31.6 |
| LOS CUST CASE | CA | Hold/Staging | 455 | 2025-07-11 | 58.7 |
| BAKER C. I. | FL | Dedicated | 294 | 2025-09-24 | 15.7 |
| RICHMOND SUB-OFFICE HOLD | VA | Hold/Staging | 277 | 2025-09-07 | 16.2 |
| BROADVIEW SERVICE STAGING | IL | Hold/Staging | 245 | 2025-09-20 | 31.7 |
| NYC HOLD ROOM | NY | Hold/Staging | 228 | 2025-06-05 | 40.9 |
| DALLAS F.O. HOLD | TX | Hold/Staging | 225 | 2025-09-18 | 53.1 |
| MONTGOMERY HOLD RM | TX | Hold/Staging | 221 | 2025-08-21 | 50.0 |
| BOSTON HOLDROOM | MA | Hold/Staging | 206 | 2025-05-13 | 18.6 |
| AZ REM OP COORD CENTER (AROCC) | AZ | Hold/Staging | 195 | 2025-04-30 | 37.4 |
| MIAMI STAGING FACILITY | FL | Hold/Staging | 176 | 2025-01-31 | 16.5 |
| ATLANTA DIST. HOLD RM | GA | Hold/Staging | 168 | 2025-06-25 | 42.1 |
| OLDHAM COUNTY JAIL | KY | Federal | 156 | 2025-09-17 | 63.1 |
| SANTA ANA DRO HOLDROOM | CA | Hold/Staging | 150 | 2025-06-11 | 11.3 |
| SAN ANTONIO DRO HOLD ROOM | TX | Hold/Staging | 145 | 2025-06-04 | 19.6 |
| INDIANAPOLIS HOLD ROOM | IN | Hold/Staging | 130 | 2025-09-19 | 12.3 |
| WASHINGTON FIELD OFFICE | VA | Hold/Staging | 127 | 2025-08-23 | 17.3 |
peak_fy25 |>
  filter(peak_pop > 0) |>
  ggplot(aes(x = peak_pop)) +
  geom_histogram(bins = 40) +
  scale_x_log10(labels = comma) +
  labs(x = "Peak detained population (FY25)", y = "Facilities")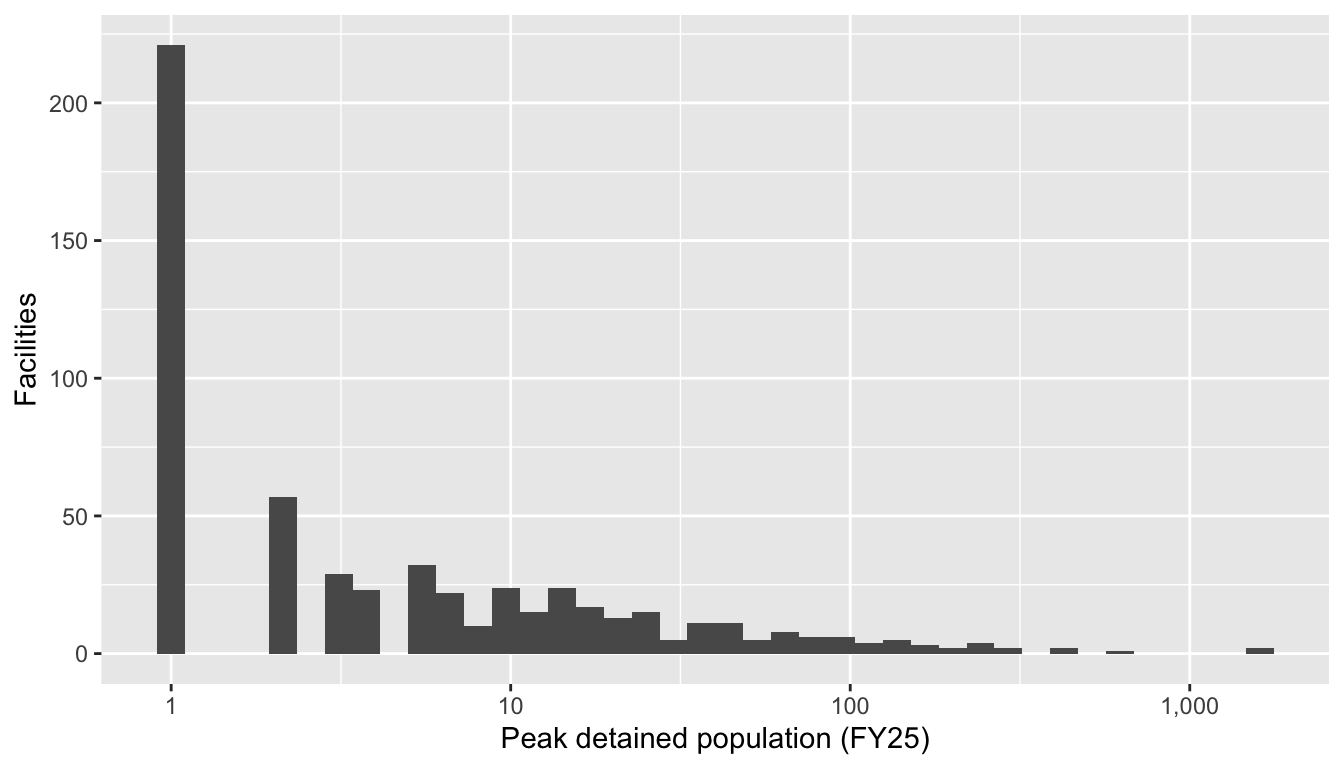
map_data <- peak_fy25 |>
  filter(peak_pop > 0, !is.na(latitude), !is.na(longitude))

map_sf <- st_as_sf(map_data, coords = c("longitude", "latitude"), crs = 4326)

type_colors <- c(
  "Dedicated"     = "#e41a1c",
  "Non-Dedicated" = "#377eb8",
  "Federal"       = "#4daf4a",
  "Hold/Staging"  = "#ff7f00",
  "Family/Youth"  = "#984ea3",
  "Medical"       = "#a65628",
  "Other/Unknown" = "#999999",
  "Unclassified"  = "#333333"
)

map_sf$type_grouped <- factor(map_sf$type_grouped, levels = names(type_colors))
present_levels <- levels(droplevels(map_sf$type_grouped))
pal <- colorFactor(palette = type_colors[present_levels], domain = present_levels)

# sqrt scale for area-proportional circle sizing
radii <- scales::rescale(sqrt(map_sf$peak_pop), to = c(3, 20))

leaflet(map_sf) |>
  addProviderTiles("CartoDB.Positron") |>
  addCircleMarkers(
    radius      = radii,
    color       = "black",
    weight      = 1,
    fillColor   = ~pal(type_grouped),
    fillOpacity = 0.7,
    label       = ~paste0(detention_facility, " (", state, ": peak ", peak_pop, ")"),
    popup       = ~paste0(
      "<b>", detention_facility, "</b><br>",
      state, " | ", type_grouped, "<br>",
      "Peak: ", peak_pop, " (", peak_date, ")<br>",
      "Mean ADP: ", mean_pop
    )
  ) |>
  addLegend(
    pal = pal, values = ~type_grouped,
    title = "Facility type", position = "bottomright"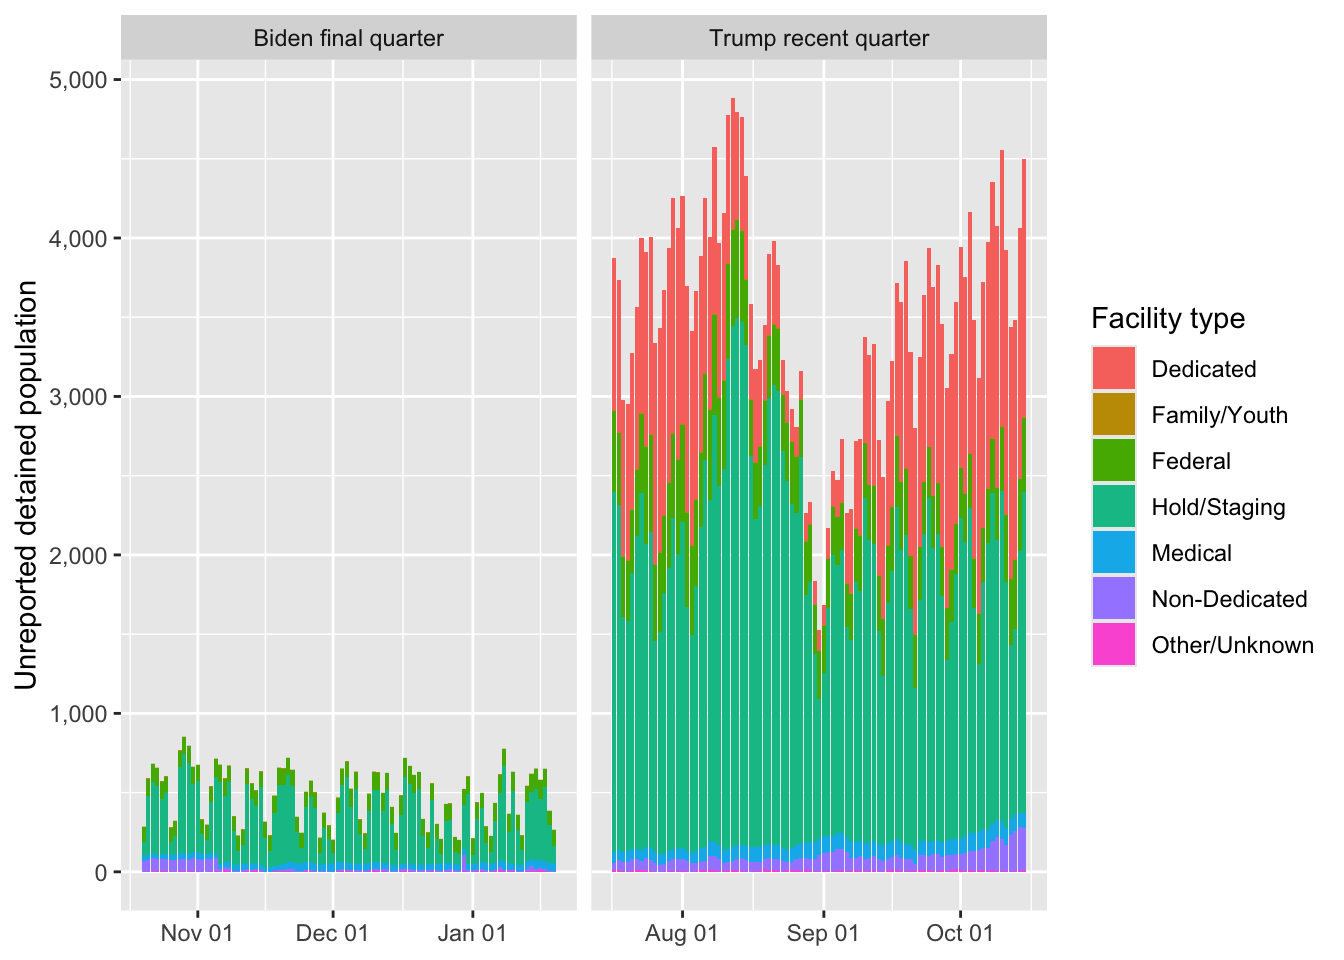
)The preceding sections establish which DDP facilities are absent from the ICE FY25 annual statistics. Here we compare the unreported population—detainees held at those unmatched facilities—during the final three months of the Biden administration versus a comparable window under the Trump administration.
biden_from <- as.Date("2024-10-20")
biden_to   <- as.Date("2025-01-19")
trump_from <- as.Date("2025-07-17")
trump_to <- as.Date("2025-10-15")bind_rows(biden_unmatched, trump_unmatched) |>
filter(peak_pop > 0) |>
group_by(period, adp_class) |>
summarise(
Facilities = n(),
`Total ADP` = round(sum(mean_pop)),
.groups = "drop"
) |>
arrange(adp_class, period) |>
kable()| period | adp_class | Facilities | Total ADP |
|---|---|---|---|
| Biden | ADP < 2 | 268 | 95 |
| Trump | ADP < 2 | 302 | 128 |
| Biden | ADP ≥ 2 | 50 | 396 |
| Trump | ADP ≥ 2 | 138 | 3372 |
bind_rows(biden_unmatched, trump_unmatched) |>
  filter(peak_pop > 0, adp_class == "ADP \u2265 2") |>
  group_by(period) |>
  summarise(
    Facilities = n(),
    `Total ADP` = round(sum(mean_pop)),
    `Mean ADP per facility` = round(sum(mean_pop) / n(), 1),
    .groups = "drop"
  ) |>
kable()| period | Facilities | Total ADP | Mean ADP per facility |
|---|---|---|---|
| Biden | 50 | 396 | 7.9 |
| Trump | 138 | 3372 | 24.4 |
type_comp <- bind_rows(biden_unmatched, trump_unmatched) |>
  filter(peak_pop > 0, adp_class == "ADP \u2265 2") |>
  group_by(period, type_grouped) |>
  summarise(
    Facilities = n(),
    ADP = round(sum(mean_pop)),
    .groups = "drop"
  )

type_comp |>
  pivot_wider(names_from = period,
              values_from = c(Facilities, ADP),
              values_fill = 0,
              names_glue = "{period} {.value}") |>
  mutate(
    `ADP change` = `Trump ADP` - `Biden ADP`,
    `% change` = if_else(
      `Biden ADP` == 0, NA_real_,
      round((`Trump ADP` / `Biden ADP` - 1) * 100, 1)
    )
  ) |>
  arrange(desc(`Trump ADP`)) |>
  kable(col.names = c("Facility type",
                       "Biden fac.", "Trump fac.",
                       "Biden ADP", "Trump ADP",
"ADP change", "% change"))| Facility type | Biden fac. | Trump fac. | Biden ADP | Trump ADP | ADP change | % change |
|---|---|---|---|---|---|---|
| Hold/Staging | 37 | 91 | 258 | 1848 | 1590 | 616.3 |
| Dedicated | 0 | 2 | 0 | 985 | 985 | NA |
| Federal | 3 | 16 | 92 | 393 | 301 | 327.2 |
| Non-Dedicated | 2 | 16 | 14 | 76 | 62 | 442.9 |
| Medical | 6 | 11 | 26 | 60 | 34 | 130.8 |
| Other/Unknown | 1 | 1 | 3 | 6 | 3 | 100.0 |
| Family/Youth | 1 | 1 | 2 | 4 | 2 | 100.0 |
bind_rows(biden_unmatched, trump_unmatched) |>
  filter(peak_pop > 0, adp_class == "ADP < 2") |>
  group_by(period, type_grouped) |>
  summarise(
    Facilities = n(),
    ADP = round(sum(mean_pop), 1),
    .groups = "drop"
  ) |>
  pivot_wider(names_from = period,
              values_from = c(Facilities, ADP),
              values_fill = 0,
              names_glue = "{period} {.value}") |>
  arrange(desc(`Trump Facilities`)) |>
  kable(col.names = c("Facility type",
                       "Biden fac.", "Trump fac.",
"Biden ADP", "Trump ADP"))| Facility type | Biden fac. | Trump fac. | Biden ADP | Trump ADP |
|---|---|---|---|---|
| Medical | 81 | 120 | 15.1 | 36.7 |
| Hold/Staging | 117 | 73 | 59.2 | 48.2 |
| Non-Dedicated | 41 | 58 | 10.3 | 21.6 |
| Federal | 25 | 43 | 10.0 | 17.6 |
| Dedicated | 2 | 4 | 0.0 | 1.4 |
| Family/Youth | 1 | 2 | 0.1 | 0.9 |
| Other/Unknown | 1 | 2 | 0.0 | 1.5 |
biden_active <- biden_unmatched |> filter(peak_pop > 0, adp_class == "ADP \u2265 2")
trump_active <- trump_unmatched |> filter(peak_pop > 0, adp_class == "ADP \u2265 2")

biden_only_codes <- setdiff(biden_active$detention_facility_code,
                             trump_active$detention_facility_code)
trump_only_codes <- setdiff(trump_active$detention_facility_code,
biden_active$detention_facility_code)if (length(biden_only_codes) > 0) {
biden_unmatched |>
filter(detention_facility_code %in% biden_only_codes) |>
arrange(desc(mean_pop)) |>
select(detention_facility, state, type_grouped, mean_pop, peak_pop) |>
mutate(mean_pop = round(mean_pop, 1)) |>
kable(col.names = c("Facility", "State", "Type", "Biden ADP", "Biden peak"))
}| Facility | State | Type | Biden ADP | Biden peak |
|---|---|---|---|---|
| KROME HOLD ROOM | FL | Hold/Staging | 21.3 | 116 |
| NYE COUNTY SHERIFF-PAHRUMP | NV | Non-Dedicated | 12.0 | 69 |
| GUAYNABO MDC (SAN JUAN) | PR | Federal | 6.6 | 12 |
| PECOS HOLD ROOM | TX | Hold/Staging | 2.7 | 27 |
| BALDWIN COUNTY COR. CENTER | AL | Non-Dedicated | 2.0 | 14 |
5 unreported facilities (ADP ≥ 2) were active in the Biden period but fell below the threshold or had zero population in the Trump period.
if (length(trump_only_codes) > 0) {
  trump_unmatched |>
    filter(detention_facility_code %in% trump_only_codes) |>
    arrange(desc(mean_pop)) |>
    select(detention_facility, state, type_grouped, mean_pop, peak_pop) |>
    mutate(mean_pop = round(mean_pop, 1)) |>
    kable(col.names = c("Facility", "State", "Type", "Trump ADP", "Trump peak"))
}| Facility | State | Type | Trump ADP | Trump peak |
|---|---|---|---|---|
| FLORIDA SOFT-SIDED FACILITY-SOUTH | FL | Dedicated | 808.4 | 1482 |
| EL PASO SOFT SIDED FACILITY | TX | Hold/Staging | 326.1 | 1606 |
| BAKER C. I. | FL | Dedicated | 176.1 | 667 |
| OLDHAM COUNTY JAIL | KY | Federal | 132.1 | 156 |
| URSULA CENTRALIZED PROCESSING CNTR | TX | Federal | 84.6 | 365 |
| MIAMI (MIRAMAR) HOLD ROOM | FL | Hold/Staging | 34.7 | 94 |
| BROOKS COUNTY JAIL (CONTRACT) | TX | Federal | 21.1 | 90 |
| BOSTON HOLDROOM | MA | Hold/Staging | 20.4 | 43 |
| SANTA ANA DRO HOLDROOM | CA | Hold/Staging | 19.5 | 96 |
| CHARLOTTE HOLD ROOM | NC | Hold/Staging | 17.6 | 48 |
| SOUTH TEXAS/PEARSALL HOLD ROOM | TX | Hold/Staging | 16.0 | 54 |
| SFR HOLD ROOM | CA | Hold/Staging | 15.6 | 44 |
| TURNER GUIFORD KNIGHT (TGK) JAIL | FL | Non-Dedicated | 14.9 | 27 |
| KANSAS CITY HOLDROOM | MO | Hold/Staging | 13.0 | 60 |
| WESTERN TENNESSEE DET. FAC. | TN | Federal | 12.6 | 74 |
| OMAHA FO HOLD | NE | Hold/Staging | 12.2 | 59 |
| JACKSONVILLE SUB-OFFICE | FL | Hold/Staging | 12.2 | 34 |
| PHI DISTRICT OFFICE | PA | Hold/Staging | 11.1 | 27 |
| MIAMI CORRECTIONAL CENTER | IN | Non-Dedicated | 11.1 | 95 |
| PRAIRIELAND SUBOFFICE HOLD ROOM | TX | Hold/Staging | 10.9 | 81 |
| TALLAHASSEE HOLD ROOM | FL | Hold/Staging | 10.5 | 52 |
| STUART HOLD ROOM | FL | Hold/Staging | 10.3 | 53 |
| CHARLESTON, SC HOLD ROOM | SC | Hold/Staging | 9.5 | 42 |
| FORT MYERS ERO HOLDROOM | FL | Hold/Staging | 7.6 | 23 |
| CENTRAL ISLIP HOLD ROOM | NY | Hold/Staging | 7.5 | 27 |
| SACRAMENTO HOLD | CA | Hold/Staging | 7.4 | 35 |
| VAL VERDE DETENTION CENTER | TX | Federal | 7.4 | 28 |
| MARTIN COUNTY JAIL | FL | Non-Dedicated | 7.4 | 24 |
| DENVER HOLD ROOM | CO | Hold/Staging | 6.5 | 21 |
| SEATTLE FIELD OFFICE HOLD ROOM | WA | Hold/Staging | 6.5 | 21 |
| CHRISTIAN COUNTY JAIL | KY | Federal | 6.4 | 51 |
| WESTMINSTER CUSTODY | CA | Hold/Staging | 6.0 | 7 |
| ST. LOUIS HOLDROOM | MO | Hold/Staging | 5.9 | 36 |
| LAS VEGAS HOLD ROOM | NV | Hold/Staging | 5.7 | 17 |
| RALEIGH HOLD ROOM | NC | Hold/Staging | 5.6 | 13 |
| HARTFORD OFFICE | CT | Hold/Staging | 5.5 | 35 |
| BROWARD COUNTY JAIL | FL | Non-Dedicated | 5.4 | 14 |
| LITTLE ROCK HOLD ROOM | AR | Hold/Staging | 5.3 | 18 |
| RIO VISTA BEHV HLTH HSP | TX | Medical | 5.2 | 14 |
| KNOXVILLE HOLD ROOM | TN | Hold/Staging | 5.1 | 20 |
| ERO HOLD ROOM (SPRINGFIELD MO) | MO | Hold/Staging | 5.0 | 62 |
| BIRMINGHAM HOLD ROOM | AL | Hold/Staging | 4.7 | 18 |
| OSCEOLA COUNTY JAIL | FL | Non-Dedicated | 4.5 | 12 |
| VICTOR VALLEY GLOBAL MED CENTER | CA | Medical | 4.5 | 9 |
| EASTERN REGIONAL JAIL | WV | Federal | 4.5 | 23 |
| HCA HOUSTON HC CONROE | TX | Medical | 4.3 | 10 |
| HOUSTON FO HOLDROOM | TX | Hold/Staging | 4.3 | 15 |
| LUBBOCK HOLD ROOM | TX | Hold/Staging | 4.2 | 22 |
| CHATTANOOGA HOLD ROOM | TN | Hold/Staging | 4.0 | 12 |
| SW VIRGINIA REG JAIL AUTH-ABG FAC | VA | Non-Dedicated | 4.0 | 47 |
| SIOUX COUNTY JAIL | IA | Federal | 4.0 | 11 |
| SAN ANGELO HOLDROOM | TX | Hold/Staging | 3.8 | 12 |
| YORK HOLD ROOM | PA | Hold/Staging | 3.8 | 14 |
| NEW HANOVER CO DET CENTER | NC | Non-Dedicated | 3.7 | 10 |
| PITTSBURGH HOLDROOM | PA | Hold/Staging | 3.7 | 17 |
| NORFOLK SUB-OFFICE HOLD | VA | Hold/Staging | 3.7 | 16 |
| EL PASO COUNTY DETENTION FACILITY | TX | Non-Dedicated | 3.6 | 19 |
| PORTLAND DISTRICT OFFICE | OR | Hold/Staging | 3.6 | 28 |
| STOCKTON STAGING FACILITY | CA | Hold/Staging | 3.6 | 15 |
| DORCHESTER CO DET CTR | SC | Federal | 3.6 | 10 |
| PLATTE COUNTY JAIL | WY | Federal | 3.6 | 12 |
| CHAVEZ DET CRT | NM | Non-Dedicated | 3.5 | 16 |
| IMPERIAL SUB OFFICE HOLD ROOM | CA | Hold/Staging | 3.4 | 21 |
| MILWAUKEE HOLDROOM | WI | Hold/Staging | 3.3 | 27 |
| RAPP SEC CENTER | VA | Federal | 3.3 | 15 |
| IRWIN COUNTY DETENTION CENTER | GA | Non-Dedicated | 3.2 | 72 |
| TOM GREEN CTY JAIL | TX | Federal | 3.2 | 11 |
| MOBILE HOLDROOM | AL | Hold/Staging | 3.1 | 21 |
| FINNEY COUNTY JAIL | KS | Non-Dedicated | 3.0 | 10 |
| ROSWELL HOLD ROOM | NM | Hold/Staging | 3.0 | 16 |
| AMARILLO HOLD ROOM | TX | Hold/Staging | 2.8 | 17 |
| HCA FLORIDA KENDALL HOSPITAL | FL | Medical | 2.8 | 6 |
| LAWRENCE CO. JAIL, SD | SD | Non-Dedicated | 2.7 | 11 |
| SALISBURY HOLD ROOM | MD | Hold/Staging | 2.7 | 23 |
| GRAND RAPIDS HOLDROOM | MI | Hold/Staging | 2.7 | 9 |
| PROVO HOLD ROOM | UT | Hold/Staging | 2.7 | 10 |
| NEWBURGH HOLDING | NY | Hold/Staging | 2.7 | 10 |
| ALBUQUERQUE HOLD ROOM | NM | Hold/Staging | 2.6 | 15 |
| MIDLAND, TX ERO HOLDROOM | TX | Hold/Staging | 2.5 | 7 |
| TULSA HOLD ROOM | OK | Hold/Staging | 2.5 | 16 |
| YAKIMA SUB-OFFICE | WA | Hold/Staging | 2.5 | 11 |
| NEW YORK PRESBYTERIAN HOSPITAL | NY | Medical | 2.4 | 5 |
| CHESAPEAKE CITY JAIL | VA | Non-Dedicated | 2.3 | 25 |
| SARASOTA COUNTY JAIL | FL | Non-Dedicated | 2.3 | 6 |
| CEDAR RAPIDS HOLD ROOM | IA | Hold/Staging | 2.2 | 17 |
| DOVER HOLDROOM | DE | Hold/Staging | 2.1 | 6 |
| FREDERICK HOLDROOM | CO | Hold/Staging | 2.1 | 7 |
| KARNES CTY CORR CTR | TX | Federal | 2.1 | 10 |
| CASCADE COUNTY JAIL, MT | MT | Federal | 2.1 | 5 |
| PIKE COUNTY ERO HOLD ROOM | PA | Hold/Staging | 2.1 | 7 |
| OGDEN HOLD ROOM | UT | Hold/Staging | 2.0 | 13 |
| GARVIN COUNTY JAIL | OK | Non-Dedicated | 2.0 | 17 |
| HILLSBOROUGH COUNTY JAIL | FL | Non-Dedicated | 2.0 | 12 |
93 unreported facilities (ADP ≥ 2) were active in the Trump period but not the Biden period.
if (length(trump_only_codes) > 0) {
  trump_unmatched |>
    filter(detention_facility_code %in% trump_only_codes) |>
    group_by(type_grouped) |>
    summarise(
      Facilities = n(),
      `Total ADP` = round(sum(mean_pop)),
      .groups = "drop"
    ) |>
    arrange(desc(`Total ADP`)) |>
    kable(col.names = c("Facility type", "Facilities", "Total ADP"))
}| Facility type | Facilities | Total ADP |
|---|---|---|
| Dedicated | 2 | 985 |
| Hold/Staging | 56 | 706 |
| Federal | 14 | 290 |
| Non-Dedicated | 16 | 76 |
| Medical | 5 | 19 |
both_codes <- intersect(biden_active$detention_facility_code,
                         trump_active$detention_facility_code)

both_compare <- biden_unmatched |>
  filter(detention_facility_code %in% both_codes) |>
  select(detention_facility_code, detention_facility, state, type_grouped,
         biden_adp = mean_pop, biden_peak = peak_pop) |>
  inner_join(
    trump_unmatched |>
      filter(detention_facility_code %in% both_codes) |>
      select(detention_facility_code,
             trump_adp = mean_pop, trump_peak = peak_pop),
    by = "detention_facility_code"
  ) |>
  mutate(
    adp_change = trump_adp - biden_adp,
    adp_pct_change = if_else(biden_adp == 0, NA_real_,
                             (trump_adp / biden_adp - 1) * 100)
)ggplot(both_compare, aes(x = biden_adp, y = trump_adp, color = type_grouped)) +
geom_abline(slope = 1, intercept = 0, linetype = "dashed", alpha = 0.5) +
geom_point(alpha = 0.7) +
scale_x_log10(labels = comma) +
scale_y_log10(labels = comma) +
labs(x = "Biden final quarter ADP", y = "Trump recent quarter ADP",
color = "Facility type")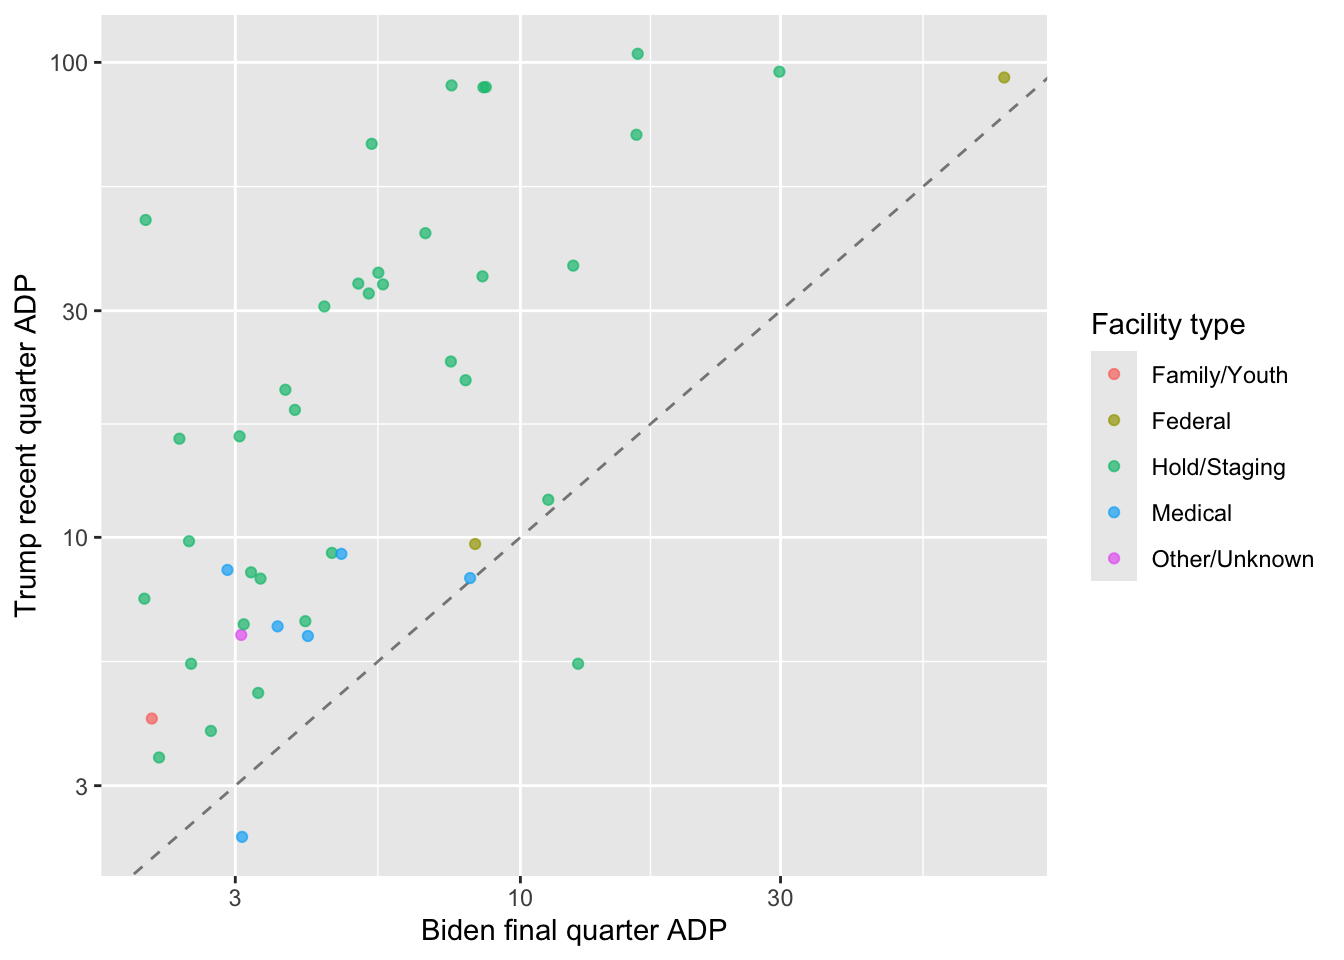
both_compare |>
  arrange(desc(adp_change)) |>
  head(15) |>
  transmute(
    Facility = detention_facility, State = state, Type = type_grouped,
    `Biden ADP` = round(biden_adp),
    `Trump ADP` = round(trump_adp),
    Change = round(adp_change)
  ) |>
kable()| Facility | State | Type | Biden ADP | Trump ADP | Change |
|---|---|---|---|---|---|
| DALLAS F.O. HOLD | TX | Hold/Staging | 16 | 104 | 88 |
| LOS CUST CASE | CA | Hold/Staging | 7 | 89 | 82 |
| ATLANTA DIST. HOLD RM | GA | Hold/Staging | 9 | 89 | 80 |
| BROADVIEW SERVICE STAGING | IL | Hold/Staging | 9 | 89 | 80 |
| MONTGOMERY HOLD RM | TX | Hold/Staging | 30 | 96 | 66 |
| NYC HOLD ROOM | NY | Hold/Staging | 5 | 67 | 62 |
| AZ REM OP COORD CENTER (AROCC) | AZ | Hold/Staging | 16 | 70 | 54 |
| BALTIMORE HOLD ROOM | MD | Hold/Staging | 2 | 47 | 45 |
| WASHINGTON FIELD OFFICE | VA | Hold/Staging | 7 | 44 | 37 |
| SAN ANTONIO DRO HOLD ROOM | TX | Hold/Staging | 5 | 36 | 31 |
| RICHMOND SUB-OFFICE HOLD | VA | Hold/Staging | 5 | 34 | 29 |
| ORLANDO HOLD ROOM | FL | Hold/Staging | 6 | 34 | 28 |
| TAMPA HOLD ROOM | FL | Hold/Staging | 5 | 33 | 27 |
| SND DISTRICT STAGING | CA | Hold/Staging | 9 | 35 | 27 |
| INDIANAPOLIS HOLD ROOM | IN | Hold/Staging | 4 | 31 | 26 |
both_compare |>
  arrange(adp_change) |>
  head(15) |>
  transmute(
    Facility = detention_facility, State = state, Type = type_grouped,
    `Biden ADP` = round(biden_adp),
    `Trump ADP` = round(trump_adp),
    Change = round(adp_change)
  ) |>
kable()| Facility | State | Type | Biden ADP | Trump ADP | Change |
|---|---|---|---|---|---|
| MCALLEN HOLD ROOM | TX | Hold/Staging | 13 | 5 | -7 |
| COLUMBIA CARE CENTER | SC | Medical | 3 | 2 | -1 |
| LARKIN BEHAVIORAL HEALTH SVCS | FL | Medical | 8 | 8 | 0 |
| MIAMI STAGING FACILITY | FL | Hold/Staging | 11 | 12 | 1 |
| SANTA MARIA SUB OFFICE ERO | CA | Hold/Staging | 3 | 4 | 1 |
| TUCSON INS HOLD ROOM | AZ | Hold/Staging | 2 | 3 | 1 |
| WACO DRO HOLD ROOM | TX | Hold/Staging | 3 | 5 | 1 |
| SALT LAKE COUNTY JAIL | UT | Federal | 8 | 10 | 1 |
| NW REG JUV DET CTR | VA | Family/Youth | 2 | 4 | 2 |
| LARKIN HOSPITAL | FL | Medical | 4 | 6 | 2 |
| KROME/MIAMI HUB | FL | Hold/Staging | 4 | 7 | 3 |
| FT LAUDERDALE BEHAVOR HLTH CTR | FL | Medical | 4 | 6 | 3 |
| JACKSON MS HOLD ROOM | MS | Hold/Staging | 2 | 5 | 3 |
| JFK INTERNATIONAL AP - T7 | NY | Other/Unknown | 3 | 6 | 3 |
| VENTURA CUSTODY CASE | CA | Hold/Staging | 3 | 7 | 3 |
ggplot(daily_unreported, aes(x = date, y = total_pop, fill = type_grouped)) +
  geom_col() +
  facet_wrap(~period, scales = "free_x") +
  scale_y_continuous(labels = comma) +
  scale_x_date(date_labels = "%b %d") +
  labs(x = NULL, y = "Unreported detained population", fill = "Facility type")